Sampled data taken at regular or random intervals can be displayed on a trend graph.
![]() 25.9.1 Sampling List
25.9.1 Sampling List
Parts ID
Parts are automatically assigned an ID number.
Historical Trend Graph ID: HT_**** (4 digits)
The letter portion is fixed. You can change the number to within the range of 0000 and 9999.
Comment
The comment for each Part can be up to 20 characters.
Part Shape
Displays the shape that you chose for the part with [Select Shape].
Select Shape
Open the Select Shape dialog box to choose the Part shape.
No Shape
Select whether the part will be transparent with no shape.
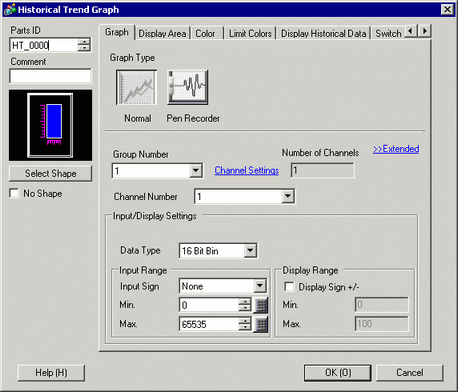
Graph Type
Select the line shape from [Normal] or [Pen Recorder].
Normal
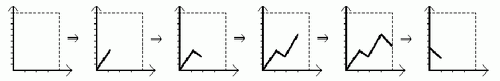
The specified word address data changes are displayed over time in a trend graph. Data at the start time is "0". As each sampling period elapses, the latest data is added in the specified [Display Direction]. When the graph line reaches the limit of the Display Area, the graph is shifted in the display direction for the number of units set in [Samples to Scroll].
For example, Display Direction: Bottom Left to Rotate Right, Data Samples: 4, Samples to Scroll: 4
Pen Recorder
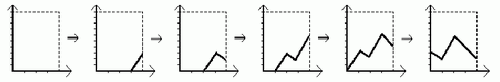
The specified word address data changes are displayed over time in a trend graph. Data at the start time is "0". The latest data always appears at the edge of the Display Area. Each time sampling occurs, the whole graph scrolls 1 spot in the set [Display Direction].
For example, Display Direction: Bottom Left to Rotate Right, Data Samples: 4
![]() 19.13.1.1 Historical Trend Graph - Graph/Basic
19.13.1.1 Historical Trend Graph - Graph/Basic
![]() 19.13.1.2 Historical Trend Graph - Graph/Extended
19.13.1.2 Historical Trend Graph - Graph/Extended
![]() 19.13.1.3 Historical Trend Graph - Display/Basic
19.13.1.3 Historical Trend Graph - Display/Basic
![]() 19.13.1.4 Historical Trend Graph - Display/Extended
19.13.1.4 Historical Trend Graph - Display/Extended
![]() 19.13.1.5 Historical Trend Graph - Color/Basic
19.13.1.5 Historical Trend Graph - Color/Basic
![]() 19.13.1.6 Historical Trend Graph - Color/Extended
19.13.1.6 Historical Trend Graph - Color/Extended
![]() 19.13.1.7 Historical Trend Graph - Limit Colors
19.13.1.7 Historical Trend Graph - Limit Colors
![]() 19.13.1.8 Historical Trend Graph - Auxiliary Line
19.13.1.8 Historical Trend Graph - Auxiliary Line
![]() 19.13.1.9 Historical Trend Graph - Display Historical Data
19.13.1.9 Historical Trend Graph - Display Historical Data